


Accuracy & Methodology
Accuracy
The following 96 locations are used to test energy consumption outputs for 7 heating and 5 cooling house archetypes. Totaling 1,152 models, outputs created with SustainableBuild calculators are plotted against outputs modeled using BEopt, a building software developed by NREL. Based on the U.S. region, different construction assemblies are modeled to capture IECC building codes that are specific to each climate zone.
The scatterplots below show the precision achieved by the SustainableBuild calculators in relation to BEopt models across the United States.
SustianableBuild and BEopt outputs are plotted against one another. Values indicate annual heating energy for a 2,200 ft2 house configured with different insulation and HVAC assemblies. Modeling outputs for each of the 7 house archetypes can be explored using the dropdown.
SustianableBuild and BEopt outputs are plotted against one another. Values indicate annual cooling energy for a 2,200 ft2 house configured with different insulation and HVAC assemblies. Modeling outputs for each of the 5 house archetypes can be explored using the dropdown.
SustainableBuild and Athena outputs are plotted against one another. Values indicate the embodied carbon for construction assemblies that reflect the material input of a 2,200 ft2 house.
Modeling Assemblies
| Assembly | Not Insulated | Poorly Insulated | Well Insulated |
| AC SEER | 14 | 14 | 14 |
| Heat Pump SEER | - | 22 | 22 |
| Gas Furnace AFUE | 0.8 | 0.8 | 0.8 |
| Electric Furnace AFUE | - | 0.98 | 0.98 |
| Heat Pump HSPF | - | 10 | 10 |
| Ducts | Unctionditioned, Insulated | Unconditoned, Insulated | Unconditoned, Insulated |
| Water Heater | Electric Standard | Electric Standard | Electric Standard |
| ACH | 7 | 7 | 2 |
Default Values and Assumptions
Building configuration is set to reflect the average American single-family home. Building geometry is set to a 5:3 aspect ratio rectangle following relationship (1) accessed through Home Energy Saver & Score: Engineering Documentation (Lawrence Berkley National Laboratory 2016). Wall height and roof pitch are set at default values of 8.5 feet and a 4:12 pitch respectively provided by RSMeans Cost Data (RSMeans 2012).

New construction window, insulation, and air infiltration baseline values are set to default statewide building code levels (IECC 2006, IECC 2009, IECC 2012, IECC 2015). These codes vary per state based on IECC legislation adoption and climate zone differences. Values specify air infiltration at ACH50, window U-Factor and SHGC, wall cavity and rigid insulation, roof insulation, and foundation insulation. Mechanical equipment is set to the current federal minimum standard for all mechanical equipment and appliances specified in the Energy Conservation Program (DOE 2018).
The calculator uses qualitative inputs, such as glazing type or quality of insulation to assign thermal values to model building assemblies. Window glazing type, based on number of panes, is correlated with specific U-Factor and SHGC values provided by Window & Skylight Construction Type Legacy System (Lawrence Berkley National Laboratory 2016). Insulation levels, ranging from none to great, are given corresponding R-Values. Values for options labeled “No Insulation” consider thermal resistance of typical wood framed construction with OSB as well as vinyl siding, asphalt roofing and the resistance of specific concrete foundation configurations. “Poor” and “Decent” values are based off ResStock National Baseline EFS v2 Data Viewer (NREL 2019). Median national values for insulation assemblies are assigned for inputs labeled “Decent” and first quartile values for insulation assemblies are assigned for inputs labeled “Poor.” Insulation assemblies labeled “Good” and “Great” use recommended minimum and maximum insulation values respectively published by the Passive Building Standard Certification Guidebook v2 (PHIUS+ 2019), which are specific for each U.S. climate zone.
The calculator uses data on equipment vintage to estimate performance of HVAC equipment, water heating equipment and large appliances. Values for all equipment and appliances are averages based on shipment weighted efficiency data.
Historical HVAC equipment uses shipment-weighted efficiency values provided by Residential End Uses: Area 1: Historical Efficiency Data (EIA and Navigant 2015). Additional shipment data is provided by GAMA and the Appliance Standards Group, which is accessed through the Home Energy Saver & Score: Engineering Documentation (Lawrence Berkley Laboratory). Water heater efficiency data is derived from GAMA values as well as Residential End Uses: Area 1: Historical Efficiency Data. Values for all large appliances, which includes refrigerators, dishwashers, clothes washers, and clothes dryers use values from Residential End Uses: Area 1: Historical Efficiency Data as well as Energy Consumption of Major Household Appliances Shipped in Canada, 1990-2016 Data Tables (Natural Resources Canada and AHAM 2019).
The calculator makes water consumption calculations based on water fixture type and plumbing configurations. Current water usage for fixtures and toilets are set to federal minimum standards and minimum Water Sense standards. Water efficiency of fixtures based on vintage use averages found in the Residential End Uses of Water Report (Water Research Foundation 2016). Data on internal piping diameter for material and nominal diameter is sourced from International Plumbing Code (International Code Council 2009).
Energy Calculations
The Construction Calculator’s function of estimating building related emissions, utility bill savings, and efficiency associated payback periods all stem from energy calculations made. While energy calculations are not displayed on the front end, these calculations are integral to the function of the calculator.
HVAC energy is calculated using the formula developed by EPA and DOE, which has been widely adopted by state and utility Technical Reference Manuals (TRM).

Where: HCapacity and CCapacity = Heating and cooling mechanical size in BTUh
EFLH = equivalent full load conditioning hours
AFUE and SEER = measures of conditioning equipment efficiency.
Although the equation is ubiquitous throughout the literature and has proven to be robust in many respects, both capacity values and EFLH values do not rely on the data and assumptions available in TRMs. Outside equations provided by AHRAE are used to increase the granularity of system capacity values and EFLH values are removed and replaced altogether using a novel method reliant on RECS 2015 Microdata (EIA 2018) , ResStock EFS v2 Data Viewer (NREL 2019), and BEopt 2.8.0 (NREL 2018).
System Capacity:
System capacity calculations in TRMs use rough baselines, such as building square footage and vintage to determine heating and cooling equipment capacity, as seen in the Energy Star Furnace Calculator (EPA DOE 2013). While this can provide general estimates, it ignores critical design inputs, like thermal heat gains and losses, solar heat gain, air infiltration, and distribution efficiency.
To determine conditioning equipment capacity based on more precise efficiency parameters and location specific climate factors, the Cooling Load Temperature Difference Calculation method, or the CLTD/CLF method, developed by ASHRAE, are used. This method considers factors such as building insulation, window performance, building volume, air infiltration, and distribution efficiency as well as regional climate factors, such as seasonal dry bulb and wet bulb temperatures, daily ranges, and elevation when sizing equipment.
Equations used can be seen here:

SEER, AFUE, and Other Efficiency Ratings:
User determined SEER and AFUE is input directly into the heating and cooling energy equations with no adjustments. The heat pump input, which uses the efficiency rating of HSPF (BTU/W-h) is changed to AFUE (BTU/BTU) to remain compatible with the formula by a unit conversion from W-h to BTU.
EFLH
Equivalent full load heating and cooling hours, known as EFLHH and EFLHC respectively are a commonly used variable in calculating energy consumption and savings within the efficiency community. While EFLH values are offered by the EPA and found in most utility and state offered TRMs, no sources provide methodology used to derive EFLH values.
Results from metering studies (KEMA and Cadmus 2010; Navigant 2010; Navigant and Cadmus 2014; Walczyk et al. 2014) show that actual mean EFLHC values are, on average, 60–70% of the original published values (ACEEE 2016).
To test the effectiveness of the EFLH values, we used average design parameters, such as mean home size, insulation, infiltration, and window performance to calculate system capacity, and used mean SEER and AFUE values to calculate energy outputs. These average values were found by analyzing data available on NREL’s ResStock Building Characteristic Data Viewer as well as analyzing EIA RECS 2015 Microdata.
When using published EFLH values, the heating and cooling end use outputs calculated were in accordance with the other analyses, showing consumption values as 40-60% higher than the values provided by EIA RECS Microdata and NREL ResStock data. When adding a correction factor to reduce EFLH factors, mapping national energy consumption values showed that discrepancies between calculated and determined consumption values deviated by varying amounts between locations. Therefore, a simple correction factor would do little to improve the accuracy for location specific values.
Rather than adjusting EFLH values further, all new heating and cooling factors were created using heating and cooling energy outputs provided by EIA RECS 2019 Microdata, NREL ResStock data and BEopt. Based on design characteristics provided by NREL ResStock, ASHRAE CLTD/CLF calculated capacity values, and known outputs for the variety of parameters provided by the data sources, EFLHH and EFLHC values could be solved for.
EFLH values were determined for 100 locations across the conterminous United States for 7 different design parameters. Once determined, using zip code level population data from the U.S. Census Bureau, heating and cooling degree day data from USGS and TMY weather data, EFLHH and EFLHC data were interpolated between locations, and values were assigned to zip codes across the U.S.
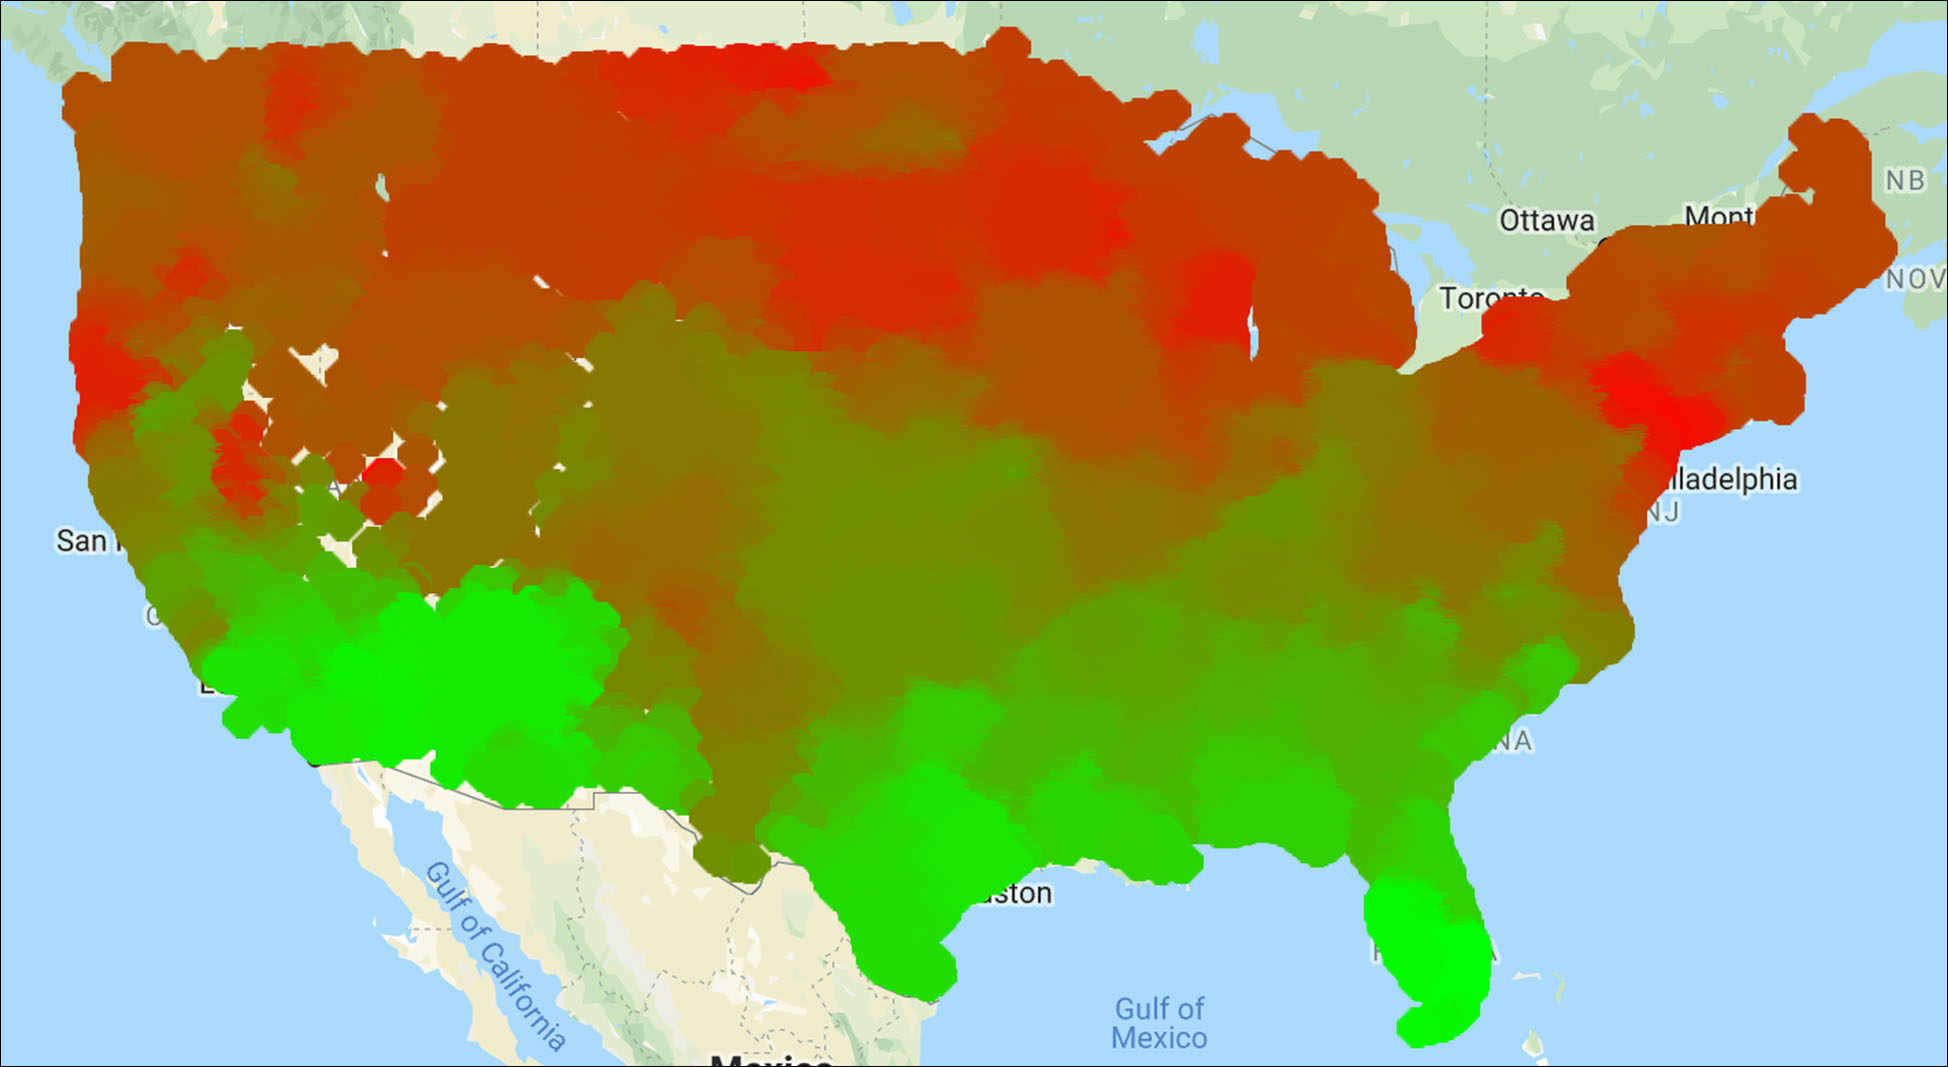
Interpolated full load heating hours for locations across the United States:
Each point represents a zip code, which is assigned an EFLH.
Water heating energy is calculated using the Water Heater Analysis Model (Lutz and Parker 2010).

Where:
Qdm = total water heater energy consumption (Btu/day)
Ef = recovery efficiency
M = mass of water drawn (lbs)
TTank = thermostat setpoint temperature (F)
Tin = inlet water temperature
Cp = specific heat of water (Btu/lb × F)
Using the formula above, the calculator determines water heating energy consumption based off inlet temperatures, which corresponds with location, house and occupancy parameters to find the amount of water drawn, and water heater efficiency factors for equipment type and vintage used.
Water Inlet Temperature:
Water inlet temperatures vary across the United States depending on latitude and elevation. Differences in inlet temperatures affect the water heating deltas thus affecting the energy consumed by water heaters at different latitudes and elevations. The Water Mains Correlation developed by Craig Christensen and Jay Burch and is described in Hendron et al. (2004) was used:

Using this formula, water inlet temperatures could be easily interpolated across regions due to our extensive work on collecting weather data, allowing for highly specific regional water temperature data.
Water Draw:
Water draw is based on occupancy, the specific distribution system and the water efficiency of each appliance. Baseline occupancy effects on water consumption were calculated using two formulas from Building America House Simulation Protocols (Hendron and Engebrecht 2010). The first calculates water draw from general fixtures, and the second calculates water waste from piping diameter and distribution layout.

Where:
Basegpd =Baseline Gallons Per day
Nbed = Number of Bedrooms
CFloor =Conditoned Floor Area
NStories =Number of Stories
VInternal =Internal Water Volume
Efficiency of Water Heating:
The recent Department of Energy change in the hot water heater efficiency metric from EF to UEF remains a foreign concept for many builders and homeowners. Rather than having this be the interfaced used, water heater configurations and fuel types, were assigned average UEF values based on market data provided by Residential End Uses: Area 1: Historical Efficiency Data (EIA and Navigant 2015). UEF values were converted to EF values using Energy Factor Conversions Equations (RESNET 2017) developed by the Department of Energy with the support of the California Energy Commission.
Once calculated, water inlet temperature, water draw and efficiency of the water heater are plugged into the Water Heater Analysis Model (Lutz and Parker 2010) and annual water energy is calculated in BTU.
Lighting loads are calculated using the Building America House Simulation Protocols (Hendron and Engebrecht 2010) method. Developed by the Department of Energy, this method estimates kWh consumed by a variety of lighting configurations based on square footage. While several load calculations have been put forth to estimate lighting energy end use, this method allows for the most seamless user interface, in which users are only required to input the relative amount of high efficiency to low efficiency lights.

Where:
FInc = fraction of hard-wired interior lamps that are incandescent
FCFL = fraction of hard-wired interior lamps that are compact fluorescent
FLED = fraction of hard-wired interior lamps that are LED
FLF = fraction of hard-wired interior lamps that are linear fluorescent
Large appliances, which include refrigerators, dishwashers, clothes washers, and clothes dryers are calculated with formulas provided by the Savings Calculator for Energy Star Qualified Products (DOE and EPA 2016). While the structure of the formulas remain the same, certain assumptions are changed to better reflect changes in appliance use since the document was developed and match end use values that have come out of EIA RECS 2015 Microdata.
Refrigerator Energy:
All refrigerators are given a Rated Annual Energy Use value in kWh by the Department of Energy. Since it is assumed that the refrigerator is operating 100% of the time, the direct kWh value determined by the DOE is inputted directly into the calculator.
Dishwasher: Like refrigerators, dishwashers are given a Rated Annual Energy Use value in kWh by the Department of Energy. The critical difference is the use of external hot water, which requires energy outside of the machine cycling. During test ratings to determine Rated Annual Energy Use, the DOE assumes a standard gas water heater is operated with a recovery efficiency of 0.8. The energy consumed by the water heater is then added to the final dishwasher Rated Annual Energy Use value. In modeling home energy use, however, the portion of this number pertaining to water use must be taken out and adjusted based on a user’s water heater fuel type and recovery efficiency factor.
To create a more flexible output based on water heater type, data on water consumption per cycle from the DOE’s Notice of Proposed Rulemaking table for the array of dishwasher efficiency classes, as well as CEE’s data on residential dishwasher efficiency specifications is used to determine water draw. Energy consumed by the water heater is then calculated using the Water Heater Analysis Model (Lutz and Parker 2010).
Clothes Washer Energy: The metric for clothes washer efficiency is known as the Integrated Modified Energy Factor, or IMEF, which is calculated as the quotient of the capacity of the clothes container divided by the total clothes washer energy consumption per cycle. The energy consumption for a clothes washer is solved for by inputting the mean clothes washer container size and number of cycles per year. IMEF includes energy used directly by the machine to run the wash cycle, energy consumed to heat the water, as well as the machine’s effectiveness at ringing out water, which in turn reduces dryer energy.
Clothes washers include a Water Factor (WF) metric, which allows for easy isolation of water consumption per wash cycle, in order to calculate water draw. It is important to note that unlike dishwashers, it is estimated that only 13% of water used in the laundry system is heated (ACEEE). From the WF, the correct hot water draw values are then used in the Water Heating Analysis Model (Lutz and Parker 2010) to determine direct hot water energy as well as clothes washer machine energy.
Clothes Dryer:
Energy efficient clothes dryers have only recently entered the market. Due to their late appearance, usage and efficiency data is less available than for other large appliances. Dryer types are designated default Energy Factors (lbs/kWh) provided by BEopt. Using average laundry loads weights and cycle numbers per year, annual energy use is calculated.
Miscellaneous Electrical Loads:
Miscellaneous electrical loads are calculated using the Building America House Simulation Protocols (Hendron and Engebrecht 2010) method. Developed by the Department of Energy, this method estimates kWh consumed using a correlation between house square footage and miscellaneous electrical loads.

CO2 Calculations
CO2 calculation methodology can be broken into two categories: electricity related CO2 calculations and onsite fuel use CO2 calculations. Electricity CO2 values use 2016 eGrid data. Zip codes are assigned to one of the 26 subregions and household kWh usage is then multiplied by average subregion grid emission rates to get an overall CO2 output for household electricity use. Onsite fuel use CO2 calculations, such as the combustion of propane, fuel oil, or natural gas for heating or cooking uses NREL’s site to source conversion factors.
Economic Calculations
Upfront costs use data provided by the National Residential Efficiency Measures Database (NREL 2018). The database provides extensive cost data for a variety of building categories and within each category, information is available for materials and equipment with different efficiency performances values. The nature of the data, however, is discrete. This creates an issue with the structure of the construction calculator’s continuous data input interface.
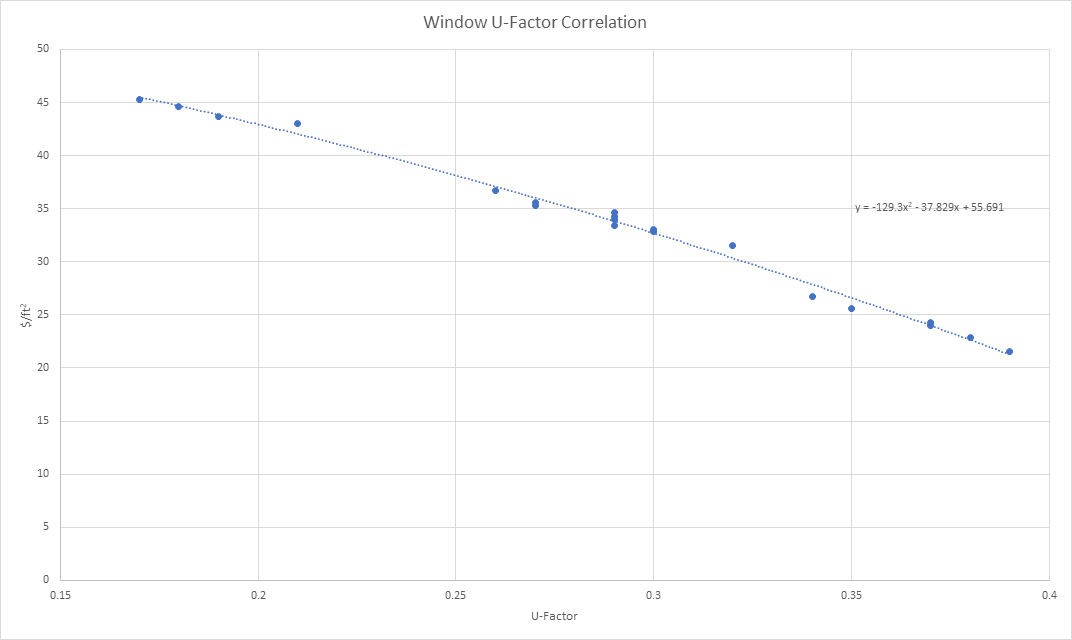
To circumvent this issue, for each building category, NREL data was plotted, comparing the material’s respective efficiency to its upfront cost. A line of best fit was added to each scatter plot to create correlative functions for upfront costs based on efficiency inputs.
Example of correlative functions created to calculate upfront costs
The calculator bases utility bill value savings and payback period calculations off the OpenEI Utility Rate Database (OpenEI 2019). Energy to bill conversions are made using statewide rate averages calculated from over 50,000 utility rates and EIA data for onsite fuel prices. Regional values per therm and per kWh are used to calculate yearly savings and payback periods. A simple payback period is calculated by subtracting bill savings from upfront costs. While the calculator does not use the typical net present value format, inflation of electricity prices is not considered, thus providing reasonable payback period estimates.